The Bollinger Bands technical indicator traces its roots back to the primordial Trading Bands or Price Envelope. Like the Price Envelope, the Bollinger indicator is built using a moving average. But unlike a Price Envelope, which includes a moving average and fixed upper and lower bands, Bollinger is composed of upper and lower bands that change in line with the price, making it more sensitive to price action and therefore relevant to today’s volatile markets.
Invented in the 1980s by John Bollinger, the Bollinger bands indicator is composed of three lines or bands. The middle band is a moving average - usually a simple or exponential 20 days moving average. The upper and lower bands are based on standard deviation and are usually plotted 2 standard deviations away from the middle, moving average line.
Traders usually use this indicator to identify support and resistance levels or overbought and oversold markets.
Since a significant part of price movement is confined within the upper and lower bands, the indicator can be beneficial in identifying support and resistance levels, whether in trending or ranging markets.
The following chart illustrates how various points on the upper and lower bands serve as support and resistance levels to the price of an asset, in this case the currency pair EURUSD. Short-term buyers, using the indicator could have taken their profits at the upper band during the uptrend, while short-term sellers might have bought back when price touched the lower band multiple times during the subsequent downtrend.
The indicator can also be used to identify overbought and oversold markets. Overbought market is spotted when the price moves closer to the upper band while oversold market is identified when the price moves closer to the lower band.
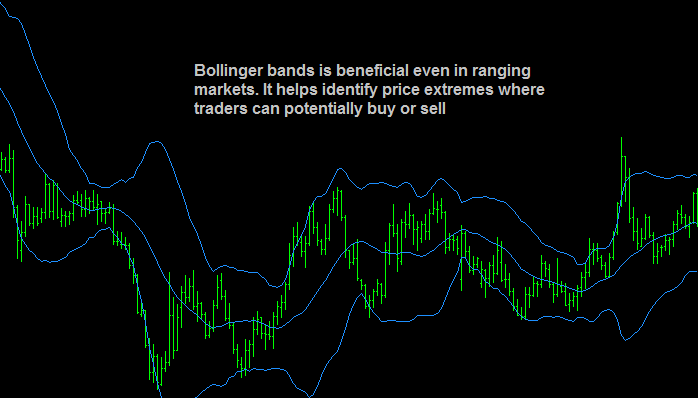
While many traders hate ranging markets because of increased noise and unpredictability, experienced users of Bollinger welcome range trading with open arms. Since the indicator captures a significant chunk of price movement within its bands, it can identify trading ranges, smooth the extreme conditions of ranging markets and identify price extremes where traders can buy or sell.
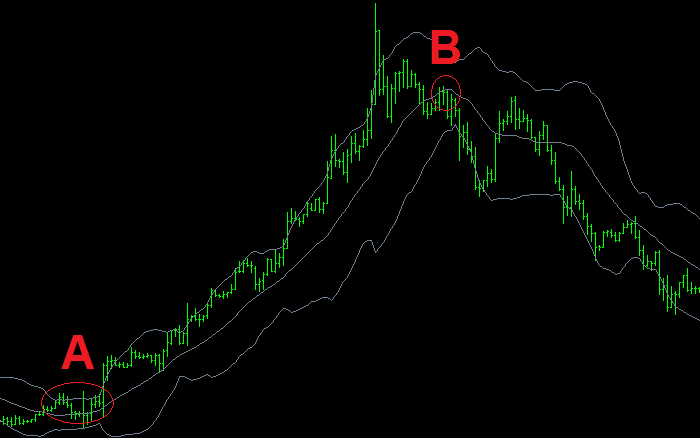
Users of the Moving Average or MA would be very familiar with a price crossover of the middle band. A crossover of price through the middle band could mark a significant shift in price trend direction. In the chart below, you could see that the middle band crossover at the point A marked the end of a downtrend and the beginning of a significant uptrend. This uptrend ended as soon as the reverse middle band crossover took place at point B. And this reverse crossover led to a downtrend (although less smooth as the prior price uptrend).
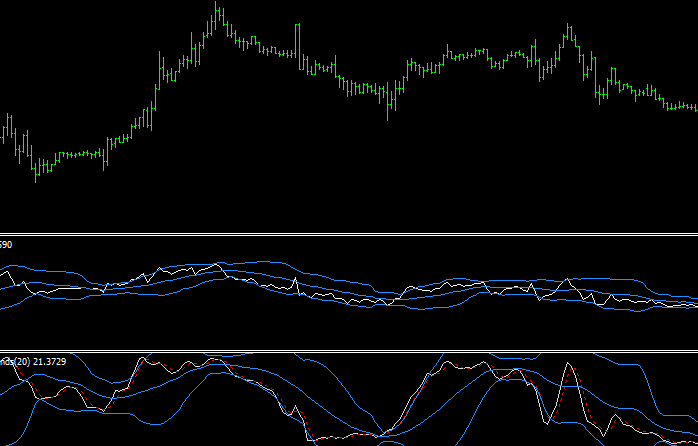
Like other technical indicators, Bollinger bands can also be overlaid on top of other indicators. In the following chart, it is overlaid on top of RSI (top) and Stochastic Oscillator (bottom). It is apparent that Bollinger captures most of the movement of these indicators within its bands.
Get the latest fundamental analyses, technical analyses and the most up to date Forex news catered to your interests.
Sign up for our weekly news and analysis newsletter.