Support and Resistance are the most fundamental concepts in technical analysis. They can be used to frame the most likely price action, to set profit targets for trades, and to work out where to place stop losses. Support exists where prices are likely (but not certain) to stop falling. Resistance exists where prices are likely (but, again, not certain) to stop rising.
Prices tend to react at these levels in the absence of new information. In any market, prices react to new information and to new orders coming into that market. When there is no new information, or no new orders hitting a market, the price action tends to be shaped by psychological levels. These are levels that exist in the minds of the numerous participants that make up any market. There are several types of support & Resistance.
In the chart below (figure 1), the most obvious level for the price to stop moving lower, would be around the lower horizontal line. And if it did stop moving lower at that level, and then started rising, then the most obvious target would be the upper horizontal line. These horizontal lines are the most basic form of support and resistance and usually apply when a market is rangebound, or consolidating.
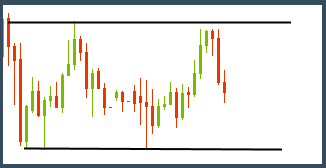
Figure 1 - horizontal lines
Support & resistance can also take the form of diagonal trend lines. If the market is moving lower, resistance will take the form of a diagonal line connecting the highs (figure 2).
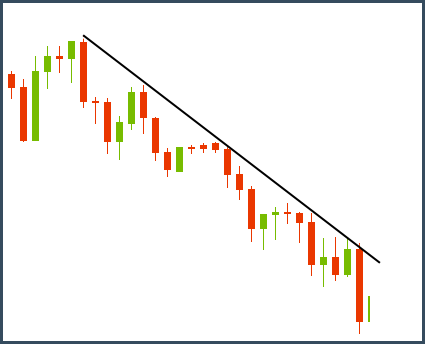
Figure 2 - diagonal resistance in a downtrend
During a uptrend, support can be formed by a trendline connecting the lows (figure 3). A resistance line could also be formed by joining the highs during an uptrend, but this would be a less reliable level than the support line. In a rising market, the trendline will form support for the trend, and will be tested each time the price comes back to that line.
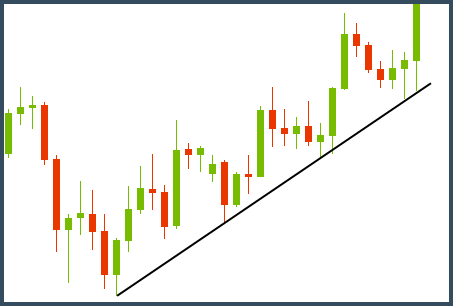
Figure 3 - diagonal resistance in an uptrend
Support and resistance lines do not have to be exact (i.e. they do not have to connect the highs or lows exactly) but the better the fit, the more likely the price will be to respect that level. The line must connect a minimum of two highs or two lows to be valid. Remember the only reason for the price to respect the line is that it is a reference point that other traders are watching.
Sometimes a moving average can act as support for a market during an uptrend, or as resistance during a downtrend. In that case the moving average acts in the same way that a trendline acts. There is no specific moving average that will always be respected by the market. Sometimes it will be the 10, sometimes the 20, and sometimes the 50-period moving average.
In figure 4, a daily chart of the EUR/JPY pair, the 80-day moving average happened to form resistance during the downtrend. Notice that at points 1-4 the relationship was still being established. At points 5 and 6, the market was very aware of this relationship, and the price fell as soon as it touched the line. And, at point 7, traders pre-empted the move and it didn’t even get to the average.
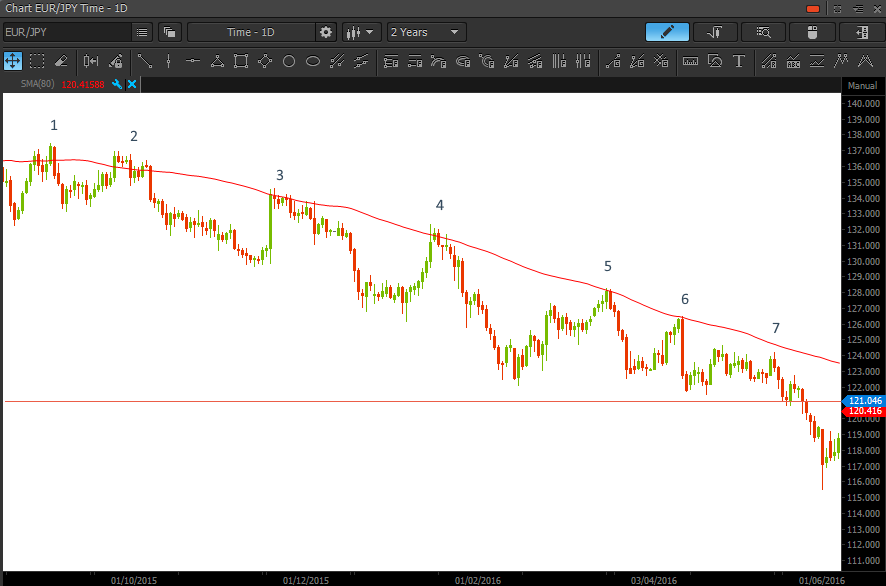
Figure 4 – the 80-day moving average form resistance during a downtrend
Fibonacci or fib levels are percentages retracements of rallies or declines in price. The most common levels are 38.2%, 50% and 61.8%. Again, these levels can form support or resistance because other traders are aware of them and tend to act when the market has retraced a certain percentage of the previous move.
In figure 5 the market fell and then retraced part of that move . In this case, it moved from Point 1 to Point 2 where resistance developed. This was at the 38.2% retracement of the down move. Support or resistance often form where fib levels are close to moving averages or trend lines.
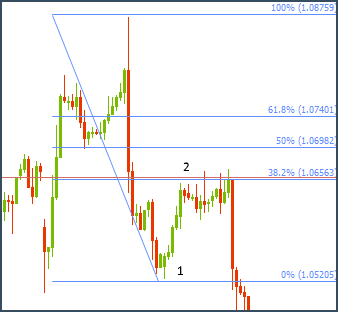
Figure 5 – fib levels
Bollinger bands are constructed with a moving average and the standard deviation for prices over the same period as the moving average. The upper and lower bands, are lines that are placed either one or two standard deviations above and below the moving average. Figure 6 shows how the market can act at these levels – especially in rangebound markets.
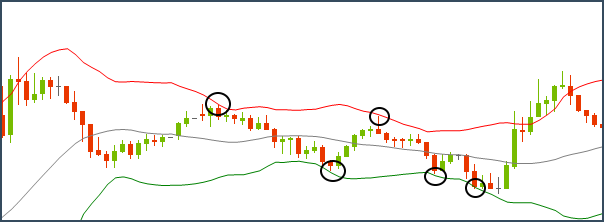
Figure 6 - Bollinger Bands
Support&resistance are the building blocks for most trading strategies - so knowing where they are likely to come into play is the most fundamental concept for any trader to master. The examples mentioned above don’t always come into play. The key is to work out which levels the market is watching and where the price has turned in the past.
81% of retail investor accounts lose money when trading CFDs with this provider. You should consider whether you can afford to take the high risk of losing your money.
Get the latest fundamental analyses, technical analyses and the most up to date Forex news catered to your interests.